Predict aberrant splicing for peri-exonic and deep intronic variants
Challenge: Splicing Mini Gene
Variant data: registered users only
Last updated: 26 October 2025
This challenge is closed. The challenge closed on 25 October 2025.
How to participate in CAGI7? Download data & submit predictions on Synapse
Make sure you understand our Data Use Agreement and Anonymity Policy
Summary
A high-throughput splicing assay was applied to assess the effect of 9,133 single nucleotide variants or small indels on splicing in a mini-gene construct transfected into HEK293 landing pad cells. The results are expressed as ΔAbS (delta Aberrant Splicing), between the variant AbS and the reference AbS. The challenge is to predict ΔAbS for each variant.
Background
Genome sequencing (GS) identifies 1000s of rare variants of unknown significance (VUS) that require functional validation to understand their effect on gene function and disease (Gudmundsson et al., 2022; Petersen et al., 2017; Frazer et al., 2021; Lowther et al., 2020; Lappalainen & MacArthur, 2021; Lappalainen et al., 2019; Jimenez-Sainz & Jensen, 2021; Walsh et al., 2021; Chen et al., 2022). One way a variant can lead to disease is by causing aberrant pre-mRNA splicing, resulting in the full or partial deletion of an exon or partial inclusion of intronic sequences, which in turn may lead to transcript degradation due to premature stop codons (Cheung et al., 2019; Scott et al., 2022). These variants do not always fall in the canonical splice sites but can be deeper intronic, synonymous, or missense variants (Cheung et al., 2019; Weil et al., 2003; Jamshidi et al., 2019), see Figure 1, and their effect is not always correctly predicted by the deep learning algorithms, such as SpliceAI (Jaganathan et al., 2019) or Pangolin (Zeng & Li, 2022). Variants that impact splicing may be difficult to detect using conventional RNA-seq alone because these variants are often spliced out of the mature mRNA, and also, the rare variants may be absent from healthy population studies such as the Genotype Tissue Expression Consortium (GTEx) (GTEx Consortium, 2020). To assess experimentally the effect of rare variants on splicing, the Bujakowska lab developed a high throughput splicing assay (HTSA), that aims to assess exon skipping, cryptic exon inclusion, and other aberrant effects caused by variants of unknown significance (Figure 1).
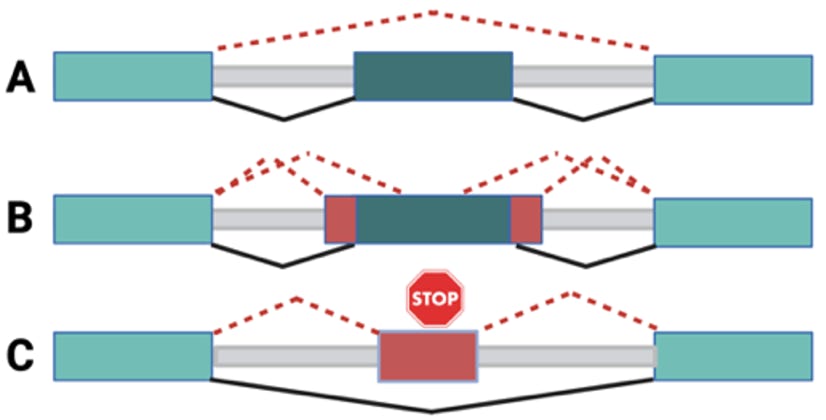
Figure 1. Aberrant splicing events to be studied by a high-throughput splicing assay (HTSA). (A) Peri-exonic variant leads to exon skipping. (B) Peri-exonic variant leads to a change in 3’ or 5’ splice site. (C) Deep-intronic variant leads to a cryptic exon inclusion. Normal splicing is presented with black lines, and abnormal splicing with red dotted lines.
Experiment: The high-throughput splicing assay (HTSA)
The HTSA is an altered version of a previously published approach that utilizes a split GFP transgene divided into two exons by an SMN1 intron (Cheung et al., 2019). Reference and variant test sequences of 270 nucleotides containing the endogenous sequence surrounding the variant (Figure 2) are cloned into the SMN1 intron as a pool of oligos (Scott et al., 2022); see Figure 3A. Subsequently, two separate experiments are performed to assess the rate of exon skipping/cryptic exon inclusion (Experiment 1, Figure 1 A and C) and other aberrant splicing evens, such as 5’ or 3’ splice site alteration (Experiment 2, Figure 1B).
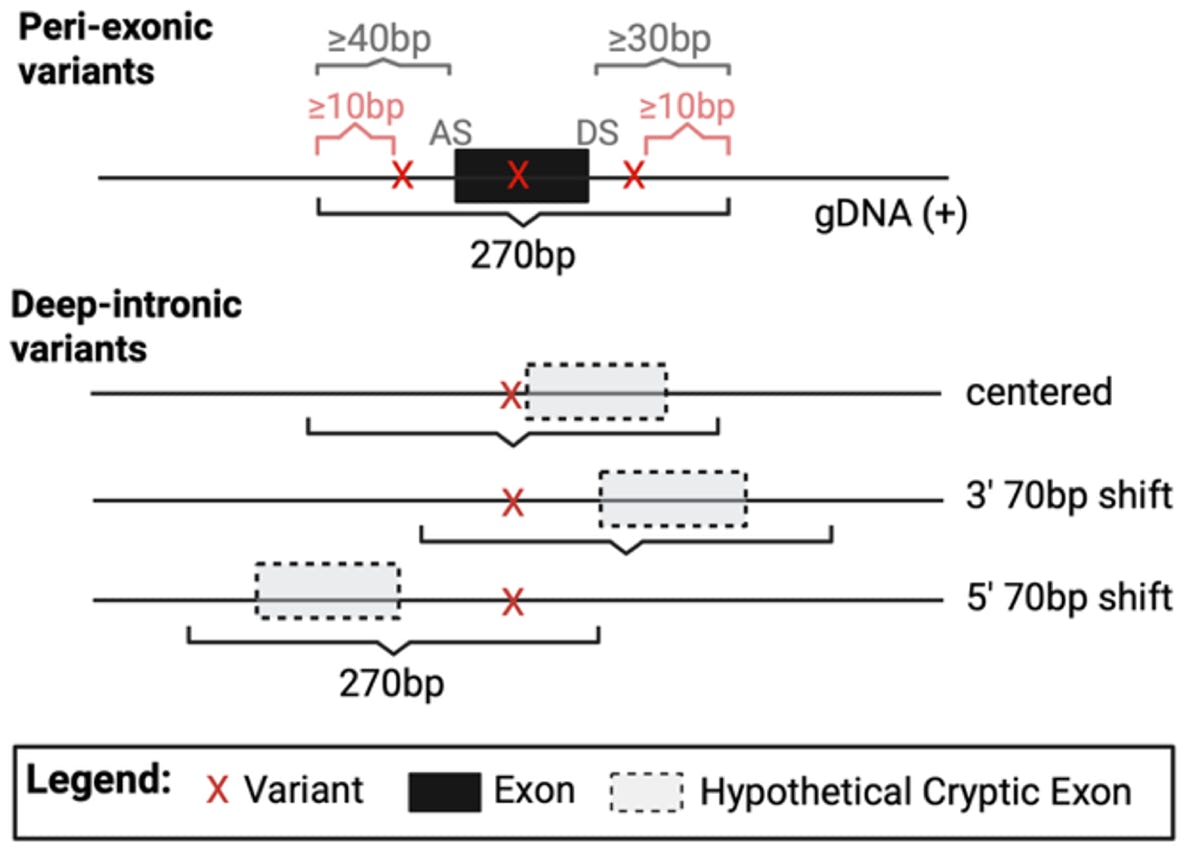
Figure 2. HTSA oligo design. For peri-exonic variants, oligos are centered on the exon, with at least 40bp of the upstream intronic sequence and 30bp of the downstream intronic sequence, and the variant present at least 10bp away from the oligo boundary (AS: Acceptor site, DS: Donor Site). For deep intronic variants, three oligos are designed, due to the unknown position of the hypothetical cryptic exon. One oligo is centered around the variant, and two additional oligos are shifted 70bp upstream or downstream.
Experiment 1: Measuring the rate of exon skipping/cryptic exon inclusion. The first experiment, which measures the rate of exon inclusion, relies on the fluorescence readout from the split-GFP construct. Inclusion of the test exon in the transgene mRNA disrupts GFP, while exon skipping allows for GFP expression (Figure 3B). A separate expression of mCherry (Red) serves as an internal fluorescence control. For each tested variant, there is a corresponding reference sequence. Additionally, essential splice site controls are included for several exons. The sequences are generated as 1000-2000 oligo pools of 300nt and cloned into the SMN1 intron of the HTSA construct. The reference, splicing control and variant libraries are cloned separately and combined for the primary screening experiment. The variant library is co-transfected with a vector containing Bxb1 integrase into the HEK293T-RCA7 landing pad cell line which allows for the integration of the minigene at the genomic safe harbor AAVS1 locus (Cheung et al., 2019; Scott et al., 2022); see Figure 3C. The integrated constructs enable expression of puromycin resistance gene, which ensures that after antibiotic selection and multiple passages the fluorescence signal observed in a single cell comes only from the integrated construct (Figure 3D). Red cells indicate GFP disruption caused by exon inclusion and yellow cells indicate GFP reconstitution due to exon skipping. The cells are separated by fluorescence activated cell sorting, genomic (g)DNA is extracted and the integrated fragments PCR amplified and deep sequenced (Figure 3E). Sequences of the integrated oligos in each cell pool (GFP-ve Splice-In vs GFP+ve Splice-Out) are determined by amplicon sequencing, counted and normalized by coverage (reads per million) and the cell sort fraction. The percent spliced-in (PSI) metric is calculated for each sequence, where PSI = normalized oligo counts in GFP-ve bin / normalized total oligo count (GFP-ve + GFP+ve bins); Figure 3E. The difference between the variant and the corresponding reference is calculated by ∆PSI = PSIVar – PSIRef, thus, increased exon skipping will result in negative ∆PSI values, such that the decrease of exon inclusion by 50% will result in the ∆PSI of -50%. Inclusion of a cryptic exon will result in positive ∆PSI values. The experiments are performed in at least triplicate, and average results are reported.
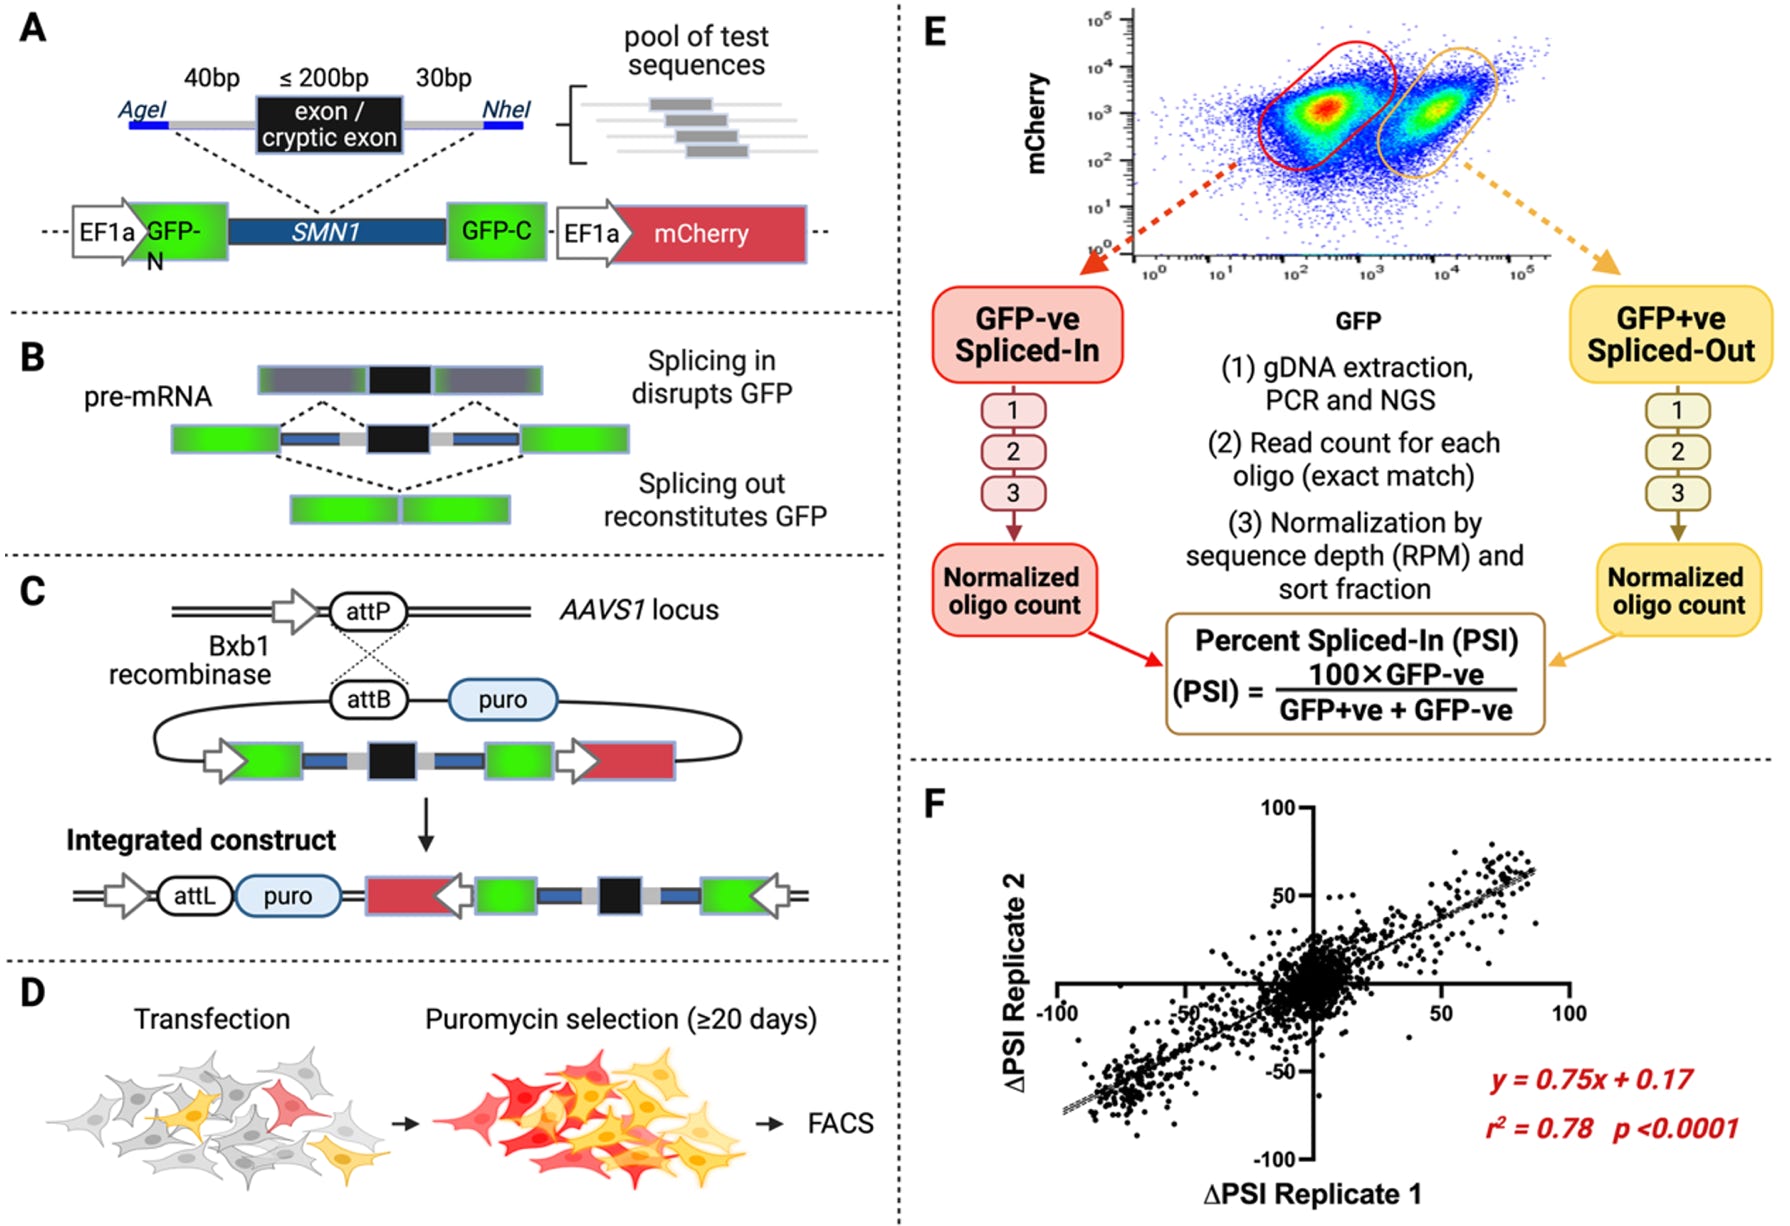
Figure 3. HTSA experiment 1 design and analysis. (A) HTSA construct with split GFP and mCherry control fluorophore. (B) Major splicing outcomes with exon inclusion or skipping resulting in GFP disruption or reconstitution. Partial exon inclusion or intron retention also lead to GFP disruption. (C) RCA7 HEK293T landing pad locus with a gene-less promoter. Successful integration enables expression of the puromycin resistance gene. (D) RCA7 HEK293T cells transfected with HTSA plasmid pool, puromycin selection, and growth. (E) Fluorescence-activated cell sorting (FACS) and downstream sample processing and data analysis. (F) Reproducibility of HTSA with delta exon inclusion indexes (∆EII) of 1750 variants from two replicates (linear regression correlation coefficient r 2 = 0.79).
Experiment 2: Measuring the rate of aberrant exon inclusion. Some aberrant splicing events, such as intron retention or partial exon inclusion, will lead to GFP disruption and thus will be indistinguishable from full exon inclusion, when measured by the PSI calculations described above. This was observed for several essential splice site controls and tested variants (Scott et al., 2022); Figure 4A. Since variants causing partial exon inclusion or intron retention may be absent from the spliced transcripts, the variant and control libraries are studied separately to enable assigning a splicing event to the causal variant. Therefore, in the secondary experiment, HEK293T-RCA7 cells are transfected with the three oligo pools separately (reference, splicing control, and variant libraries), cultured, and the total RNA is extracted, RT-PCR amplified and analyzed by amplicon sequencing (Figure 4B). The transcripts are aligned to the human transcriptome, and the spliced-in sequences are compared to the reference exons (Figure 4C). The Percent Reference Exon Splicing (PRES) is calculated for each oligo, and the difference between the variant and the corresponding reference is calculated by ∆PRES (Figure 4C, D). The experiments are performed in at least triplicate, and average results are reported.
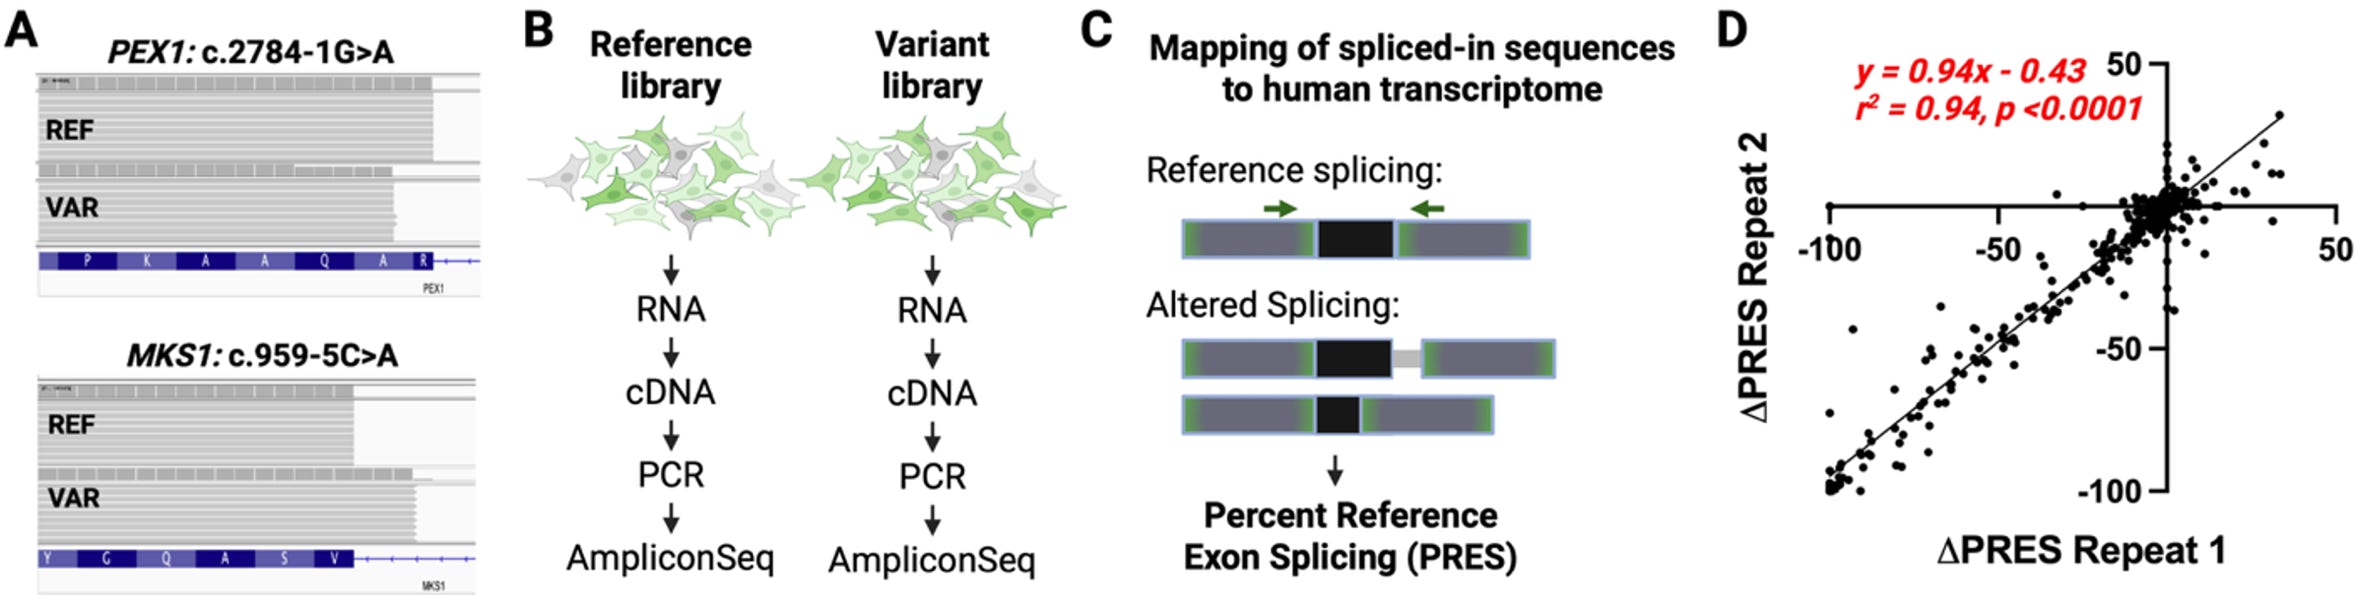
Figure 4. HTSA experiment 2 design and analysis. (A) Examples of two variants in two different genes leading to aberrant exon inclusion, resulting in exon truncation or partial intron inclusion. (B) Experimental design for the parallel reference and variant library experiments, where spliced-in sequences are analyzed by amplicon sequencing. (C) Analysis of the sequence data by mapping to the human transcriptome and categorizing reference or altered splicing for each oligo sequence (reference or variant), resulting in the calculation of the percent reference exon splicing (PRES) metric. (D). ∆PRES = PRESVar – PRESRef values from two independent experiments show high reproducibility.
Overall Aberrant Splicing Score. Each experiment measures PSIVar, PSIRef, PRESVar and PRESRef and each variant will receive an overall Aberrant Splicing Score that combines both measurements in the case of peri-exonic variants. For example, if a peri-exonic variant leads to exon skipping with ∆PSI = -50% (PSIVar = 0.5; PSIRef = 1) and if only 30% of the remaining 50% of spliced-in transcripts show reference exon splicing (PRESVar = 0.3), whereas all of the spliced-in transcripts show reference exon splicing for the reference allele (PRESRef = 1), then the Aberrant Splicing Score of the variant (AbSVar) and the Aberrant Splicing Score of the reference (AbSRef) are calculated as:
AbSVar = 1 – PSIVar ⋅ PRESVar = 1 – 0.5 ⋅ 0.3 = 1 – 0.15 = 0.85
AbSRef = 1 – PSIRef ⋅ PRESRef = 1 – 1 ⋅ 1 = 0
and the Delta Aberrant Splicing Score (∆AbS) will be expressed as the difference of the two scores:
∆AbS = AbSVar – AbSRef
= PSIRef ⋅ PRESRef – PSIVar ⋅ PRESVar
= 1 ⋅ 1 – 0.5 ⋅ 0.3
= 1 – 0.15
= 0.85
For deep intronic variants, there is no reference exon and thus PRESVar and PRESRef are not used. If a deep intronic variant causes the inclusion of a cryptic exon with ∆PSI = 90% (PSIVar = 1, determined as the maximum PSIVar over the three tested intronic oligos; PSIRef = 0.1), the Delta Aberrant Splicing Score (∆AbS) will be calculated as:
∆AbS = ∆PSI
= 0.9
The experimentally measured ∆AbS scores are expected to be between 0 and 1. However, a negative score; that is, a score between -1 and 0 can also be observed unexpectedly. The assessors will decide whether to remove those variants from consideration as they may reflect problems with the experiment.
The task for predictors is to predict the overall delta aberrant splicing score (∆AbS). Note however that the assessment team may explore alternative ways of expressing aberrant splicing from this HTSA that are not available at the time of posting this challenge.
Prediction challenge
Participants are asked to submit predictions of ∆AbS, in addition to the values of PSIRef, PRESRef, PSIVar and PRESVar. Optionally, a comment on the basis of the prediction may be given if the submitter generates an intermediate or indeterminate result.
Submission format
The prediction submission is a comma-separated text file. Organizers provide a template file, which should be used for submission. In addition, a validation script is provided, and predictors should check the correctness of the format before submitting their predictions. In the submitted file, each row includes the following columns:
Each data row in the submitted file must include the following columns:
- Variant = the variant as listed in the submission template file (GRCh38)
- PSIRef = percent of reference or cryptic exon spliced-in (i.e. normalized oligo count in GFP-ve bin / normalized total oligo count (GFP-ve + GFP+ve bins) in Experiment 1) when the reference allele is present
- PSIVar = percent of reference or cryptic exon spliced-in (i.e. normalized oligo count in GFP-ve bin / normalized total oligo count (GFP-ve + GFP+ve bins) in Experiment 1) when the alternate allele is present
- ∆PSI = PSIVar - PSIRef
- PRESRef = percent of full-length reference exon splicing when the variant is not present
- PRESVar = percent of full-length reference exon splicing when the variant is present
- ∆AbS = overall aberrant splicing score, a score between 0 and 1, where 0 indicates no aberrant splicing, 1 indicates maximal aberrant splicing.
- Standard deviation = SD of the prediction in column 7, indicating confidence in prediction
- Comment = optional brief comment
In the template file, cells in columns 2-9 are marked with a "*". Submit your predictions by replacing the "*" with your value. No empty cells are allowed in the submission. You must enter a prediction and standard deviation for every variant; if you are not confident in a prediction for a variant, enter a large standard deviation for the prediction. Optionally, enter a brief comment on the basis of the prediction, otherwise, leave the "*" in these cells. Please make sure you follow the submission guidelines strictly. In addition, your submission must include a detailed description of the method used to make the predictions, similar to the style of the Methods section in a scientific article. This information will be submitted as a separate file.
File naming
CAGI allows submission of up to six models per team, of which model 1 is considered primary. You can upload predictions for each model multiple times; the last submission before deadline will be evaluated for each model. If you are submitting a single file with all predictions combined, please use the format below.
Use the following format for your submissions: <teamname>_model_(1|2|3|4|5|6).(csv|txt)
To include a description of your method, use the following filename: <teamname>_desc.*
Example: if your team’s name is “bestincagi” and you are submitting predictions for your model number 3, your filename should be bestincagi_model_3.txt.
Sample data
We provide sample data for 1,257 variants in cagi7splicingsample.csv (see below), which includes experimental scores from this challenge.
Download data
Download the 9,133 variants: cagi7splicingvariantlist.csv (provided on Synapse)
Download the list of 1,257 sample variants: cagi7splicingsample.csv (provided on Synapse)
Download submission template: cagi7splicingtemplate.csv (provided on Synapse)
Dataset provided by

Kinga Bujakowska, Harvard Medical School
Related challenges
References
Chen S, et al. A genome-wide mutational constraint map quantified from variation in 76,156 human genomes. Nature (2024) 625(7993):92-100. PubMed
Cheung R, et al. A multiplexed assay for exon recognition reveals that an unappreciated fraction of rare genetic variants cause large-effect splicing isruptions. Mol Cell (2019) 73(1):183-194.e8. PubMed
Frazer J, et al. Disease variant prediction with deep generative models of evolutionary data. Nature ( 2021) 599(7883):91-95. PubMed
GTEx Consortium. The GTEx Consortium atlas of genetic regulatory effects across human tissues The Genotype Tissue Expression Consortium. Science (2020) 369(6509):1318-1330. PubMed
Gudmundsson S, et al. Variant interpretation using population databases: lessons from gnomAD. Hum Mutat (2022) 43(8):1012-1030. PubMed
Jaganathan K, et al. Predicting splicing from primary sequence with deep learning. Cell (2019) 176(3):535-548.e24. PubMed
Jamshidi F, et al. Contribution of noncoding pathogenic variants to RPGRIP1-mediated inherited retinal degeneration. Genet Med (2019) 21(3):694-704. PubMed
Jimenez-Sainz J, Jensen RB. Imprecise medicine: BRCA2 Variants of Uncertain Significance (VUS), the challenges and benefits to integrate a functional assay workflow with clinical decision rules. Genes (2021) 12(5):780. PubMed
Lappalainen T, MacArthur DG. From variant to function in human disease genetics. Science (2021) 373(6562):1464-1468. PubMed
Lappalainen T, et al. Genomic analysis in the ge of human genome sequencing. Cell (2019) 177(1):70-84. PubMed
Lowther C, et al. Systematic evaluation of genome sequencing as a first-tier diagnostic test for prenatal and pediatric disorders. bioRxiv 2020:2020.08.12.248526
Petersen BS, et al. Opportunities and challenges of whole-genome and -exome sequencing. BMC Genet (2017) 18(1):14. PubMed
Scott HA, et al. A high throughput splicing assay to investigate the effect of variants of unknown significance on exon inclusion. medRxiv 2022.11.30.22282952
Walsh R, et al. Enhancing rare variant interpretation in inherited arrhythmias through quantitative analysis of consortium disease cohorts and population controls. Genet Med (2021) 23(1):47-58. PubMed
Weil D, et al. Usher syndrome type I G (USH1G) is caused by mutations in the gene encoding SANS, a protein that associates with the USH1C protein, harmonin. Hum Mol Genet (2003) 12(5):463-471. PubMed
Zeng T, Li YI. Predicting RNA splicing from DNA sequence using Pangolin. Genome Biol (2022) 23(1):103. PubMed
Revision history
04 August 2025: challenge preview posted
08 August 2025: challenge released
11 October 2025: submission deadline extended from October 15 to October 25.
26 October 2025: challenge closed on October 25