Identify causal variants and estimate their effects on splicing in a Massively Parallel Splicing Assay (MaPSy)
Challenge: MaPSy
Dataset description: public
Dataset availability: registered users only
Exome sequence data: registered users only, limited by CAGI Data Use Agreement
Last updated: 24 April 2018
This challenge will tentatively close at 8:00 PM PST (Pacific Standard Time) on 7 May 2018.
Download answer key and predictions: registered users only, limited by CAGI Data Use Agreement. The answer key and predictions are accessible to registered users only, and their use is limited by the CAGI Data Use agreement. Please log in to access the file.
Presentations from the CAGI 5 conference: registered users only, limited by CAGI Data Use Agreement. Presentations are accessible to registered users only, and their use is limited by the CAGI Data Use Agreement. Please log in to access the file.
Notice
Please note that the training data provided have 13 ESMs where the in-vivo and in-vitro assays indicate different directional effects on splicing. To be consistent with the description and the analysis in the paper, those should not be regarded as ESMs and be ignored.
This dataset file is available only to registered users. Please log in to access the file.
Summary
The Massively Parallel Splicing Assay (MaPSy) approach was used to screen 797 reported exonic disease mutations using a mini-gene system, assaying both in vivo via transfection in tissue culture, and in vitro via incubation in cell nuclear extract. The challenge is to predict the degree to which a given variant causes changes in splicing.
Background
The Fairbrother lab developed a Massively Parallel Splicing Assay (MaPSy) (Soemedi R et al. 2017) to screen a panel of 4,964 exonic disease mutations reported in the Human Gene Mutation Database (HGMD) (Stenson PD et al., 2003) not classified as splicing mutations for splicing defects and synthesized a library of sequence pairs consisting of the reported mutant sequences as well as their WT counterparts. This library was then incorporated into artificial genes to be used in the splicing assay in vivo and in vitro. For ~10% of the mutations MaPSy confirmed both in vivo and in vitro alter splicing. Such mutations are now classified as exonic splicing mutations (ESMs) (Soemedi R et al., 2017).
Experiment
Nonsynonymous mutations classified as disease-causing (DM) were downloaded from HGMD. Mutations were mapped to internal exons ≤ 100 nucleotides in length and selected for those that fit into 170 nucleotide genomic windows, which include 15 nucleotides of downstream intronic sequence and ≥ 55 nucleotides of upstream intronic sequence (for a total of 4,964 variants). The mutant and wildtype versions of the 170-mer genomic fragments were flanked with 15-mer common primers and synthesized as a 200-mer oligo library (Figure 1A).
Additional missense and nonsense mutations (n= 797) were also mapped to exons of length >100 nucleotides Each such exon has been “cut” in the following way: - 5’ and 3’ splice site signals have been preserved. - A portion(s) of the middle portion of the exon was/were removed to decrease its size to <= 100 nucleotides in order to meet the requirements of oligonucleotide synthesis at the time of the experiment.
One library of the assay was designed to evaluate the effects of the mutations on splicing in vivo via transfection in cells grown in tissue culture (Figure 1B). The second library of the assay comprised RNA substrates designed to evaluate the mutations’ effects on splicing in vitro via incubation in cell nuclear extract.
For the in vivo assay, the sequence pairs were incorporated into three-exon minigenes and transfected into HEK293 cells. After 24-hours, RNA was recovered, converted to cDNA, and made into Illumina libraries for parallel sequencing. The allelic ratios (WT to mutant) were determined by sequencing the input DNA and the output RNA (cDNA). Three replicates were performed.
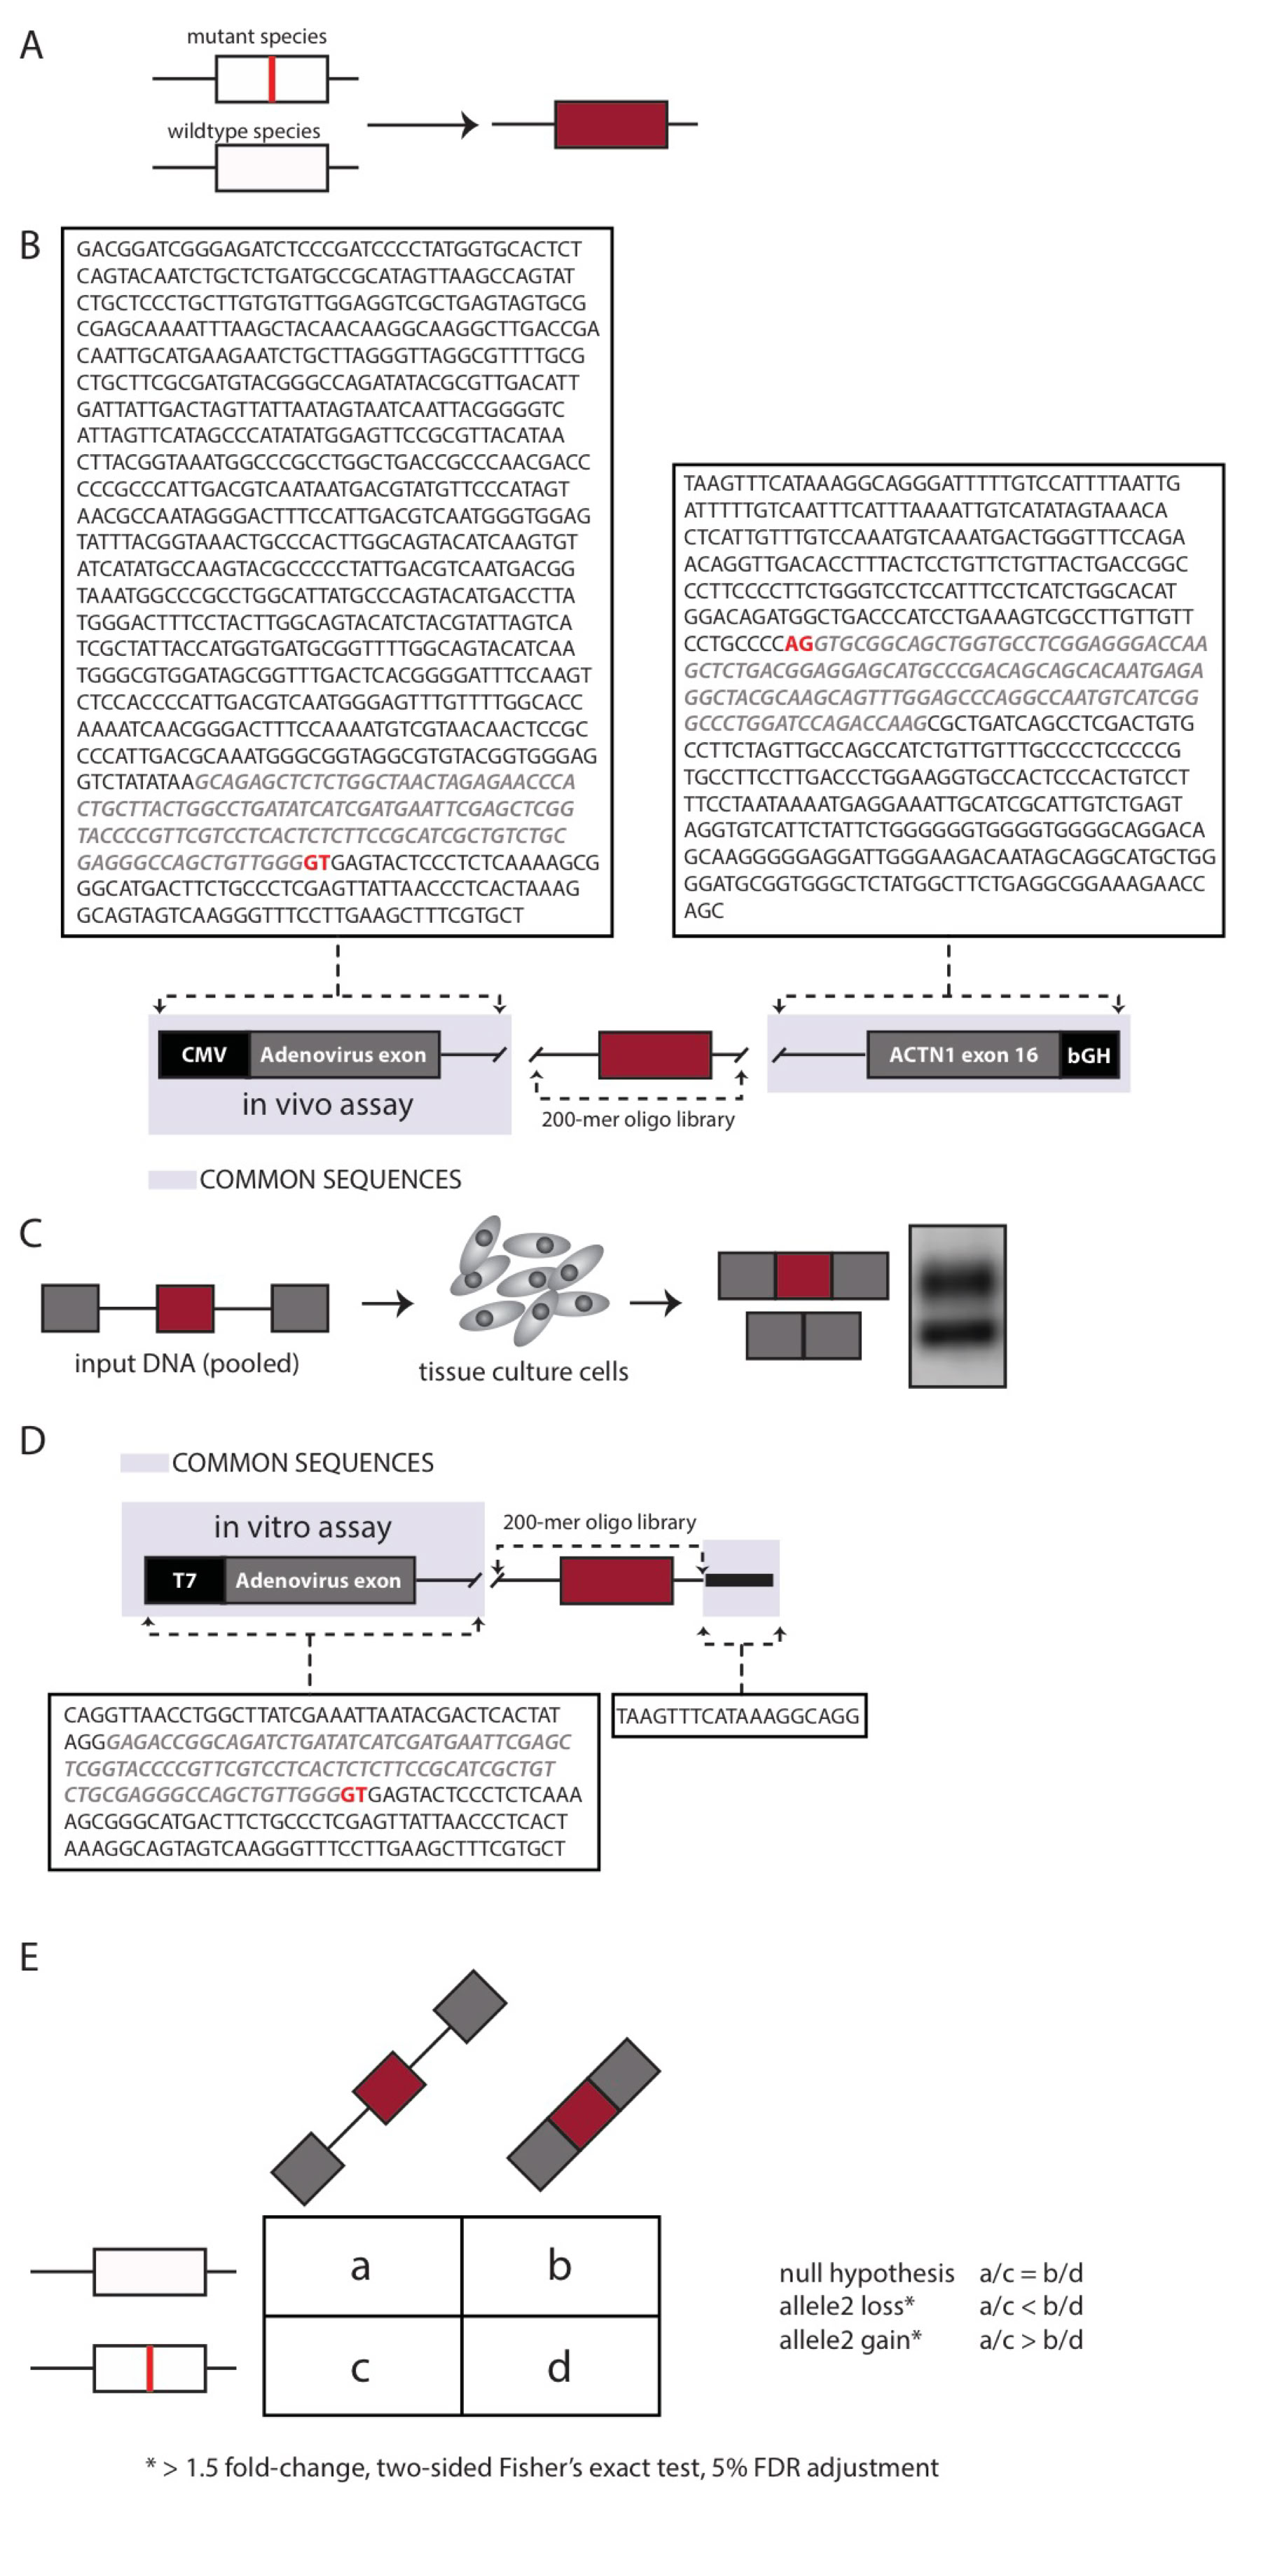
To identify the presence of allelic imbalances in splicing efficiency, sequencing reads were classified into the following categories: • wild-type (WT) DNA input (a), • WT spliced RNA species (b), • Mutant (MT) DNA input (c), • MT spliced RNA species (d).
The term “spliced” refers to species that have perfect splicing to include the reference-annotated exon. Any other spliced species (such as exon skipping, alternative 3’ or 5’ splice sites, intron retention) are not considered in this measure. .
The read counts from input DNA were compared with the read count of of correctly spliced cDNA were compared. Statistical tests were subsequently conducted to determine significance of the allelic imbalances in splicing efficiency.
These changes were interpreted as follows (Figure C): - input WT (a) / input mutant(c) = spliced WT (b)/ spliced mutant (d) implies the mutation was neutral - input WT (a) / input mutant (c) < spliced WT (b) /spliced mutant (d), implies a mutant loss in splicing efficiency - input WT (a) / input mutant (c) > spliced WT (b) /spliced mutant (d) implies a mutant gain in splicing efficiency.
The allelic ratios for MaPSy analyses were calculated as:
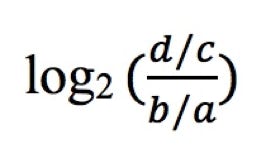
Where d is the count of mutant spliced species, c is the count of mutant input, b is the count of wild-type spliced species and a is the count of wild-type input.
Across the 5K panel, 14% of mutations lead to loss in splicing efficiency , 4% lead to gain in splicing efficiency and the rest were unchanged. To assess splicing efficiency between individual species, the Fairbrother laboratory developed a specific splicing index for each species (Soemedi et al., 2017). Fisher’s exact test (adjusted with 5% FDR) was performed to find differences in splicing).
For the in vitro assay, the library was incorporated into two-exon constructs and incubated in HeLa nuclear extract so that splicing could occur. Afterwards, RNA was extracted, converted to cDNA, and subjected to parallel sequencing. Any change in the allelic ratio of the spliced/input was characterized as aberrant splicing. Two replicates were performed. A total of 17% of mutations lead a mutant loss, while 17% lead to a mutant gain. Unspliced RNA was the most common change in vitro.
~9%(453/4,964) of mutations in the 5K panel of exonic mutations showed splicing defects in both the in vivo and the in vitro splicing assays. In contrast, 3% (7/228) of common SNPs altered splicing in both assays.
81% (26/32) of tested MaPSy-detected ESMs were validated in patient tissue samples (consisting of LCLs, fibroblasts, whole blood and postmortem brain tissues).
Prediction challenge
Participants are asked to submit predictions of variants in the test set. Participants should provide the probability that each variant is an ESM (that passed the 1.5 fold change and a two-sided Fisher’s exact test adjusted with 5% FDR both in vitro and in vivo). In addition, given the input read counts of the WT input (a) and MT input (c) the participants should predict the log2 allelic skew ratio for in vivo and in vitro panels for each pair in the test set.
Training set: As a training set, we provide variants that were tested by MaPSy. The training set includes all 4,964 published variants. For every mutant/wildtype pair in the training dataset we provide the following:
- Wildtype id: lab identifier for the construct (e.g., CM051582W)
- Mutant id: lab identifier for the construct (e.g., CM051582M)
- Sequence_wildtype –wildtype in vivo and in vitro 200-mer oligo sequence,
- Sequence_mutant – mutant in vivo and in vitro 200-mer oligo sequence,
- Exon_start – exon/intron boundary (hg19 coordinate of first nucleotide of the exon) that has been used to determine allelic skew
- Exon_end – exon/intron boundary (hg19 coordinate of last nucleotide of the exon) that has been used to determine allelic skew
- vivo_wildtype_spliced – count of reads in the spliced fraction for the wildtype in vivo (b)
- vivo_mutant_spliced – count of reads in the spliced fraction for the mutant in vivo (d)
- vivo_wildtype_input – count of reads in the input for the wildtype in vivo (a)
- vivo_mutant_input – count of reads in the input for the mutant in vivo (c)
- vitro_wildtype_spliced – count of reads in the spliced fraction for the wildtype in vitro (b)
- vitro_mutant_spliced – count of reads in the spliced fraction for the mutant in vitro (d)
- vitro_wildtype_input – count of reads in the input for the wildtype in vitro (a)
- vitro_mutant_input – count of reads in the input for the mutant in vitro (c)
- log2_vivo_allele_ratio – mutant/wildtype log2 ratio in vivo panel
- log2_vitro_allele_ratio – mutant/wildtype log2 ratio in vitro panel
- ESM – class column stating if the variant is an ESM (passed the threshold in both assays; 0 means not_ESM; 1 means ESM).
Test set: The test set includes all 797 mutant/wildtype pairs of variants. The sequence for both constructs are provided as well as the counts for the input for both mutant and wildtype species for both panels. The file format is as follows:
- Wildtype id – lab identifier for the construct (e.g., CM051582W)
- Mutant id – lab identifier for the construct (e.g., CM051582M)
- Sequence_wildtype – wildtype in vivo and in vitro 200-mer oligo sequence,
- Sequence_mutant – mutant in vivo and in vitro 200-mer oligo sequence,
- Exon_start – exon/intron boundary (hg19 coordinate of first nucleotide of the exon) that has been used to determine allelic skew,
- Exon_end – exon/intron boundary (hg19 coordinate of last nucleotide of the exon) that has been used to determine allelic skew,
- In vivo_wildtype_input – count of reads in the input for the wildtype in vivo
- In vivo_mutant_input – count of reads in the input for the mutant in vivo
- In vitro_wildtype_input – count of reads in the input for the WT in vitro
- In vitro_mutant_input – count of reads in the input for the mutant in vitro
Prediction submission format
The prediction submission for the 797 variants is a tab-delimited text file. Organizers provide a template file, which must be used for submission. In addition, a validation script is provided, and predictors must check the correctness of the format before submitting their predictions. Each data row in the submitted file must include the following columns:
- Wildtype_species – wildtype id (e.g., CM051582W)
- Mutant_species – mutant id (e.g., CM051582M)
- In vivo_wildtype_spliced – count of reads in the spliced fraction for the wildtype in vivo
- In vivo_mutant_spliced – count of reads in the spliced fraction for the mutant in vivo
- In vitro_wildtype_spliced – is the count of reads in the spliced fraction for the WT in vitro
- In vitro_mutant_spliced – is the count of reads in the spliced fraction for the mutant in vitro
- Log2_vivo_allele_ratio – mutant/wildtype log2 ratio in vivo panel
- Standard deviation - SD of the prediction in column 7
- Log2_vitro_allele_ratio – mutant/wildtype log2 ratio in vitro panel
- Standard deviation - SD of the prediction in column 9
- ESM – The probability that this variant is an ESM. The probability should be a value between 0 and 1, with 0 meaning not ESM and 1 meaning ESM.
- Standard deviation - SD of the prediction in column 11
In the template file, cells in columns 7-12 are marked with a "*". Submit your predictions by replacing the "*" with your value. No empty cells are allowed in the submission. For a given subset, you must submit predictions and standard deviations for all or none of the variants; if you are not confident in a prediction for a variant, enter an appropriate large standard deviation for the prediction. Optionally, enter a brief comment on the basis of the prediction. If you do not enter a comment on a prediction, leave the "*" in those cells. Please make sure you follow the submission guidelines strictly.
In addition, your submission must include a detailed description of the method used to make the predictions, similar to the style of the Methods section in a scientific article. This information must be submitted as a separate file.
To submit predictions, you need to create or be part of a CAGI User group. Submit your predictions by accessing the link "All submission forms" from the front page of your group.For more details, please read the FAQ page.
Download dataset: This dataset file is available only to registered users. Please log in to access the file.
Download submission template: This submission template file is available only to registered users. Please log in to access the file.
Download validation script: This submission validation script is available only to registered users. Please log in to access the file.
Related Challenges
Vex-seq
Note that the MaPSy challenge differs in subtle but important ways from the Vex-seq challenge, in addition to the experimental method differences. Both challenges measure abudnace of the RNA species with the reference test exon perfectly spliced in, but the nature of the exon and the RNA species being compared with are different. Vex-seq measures only reference splicing of either exon inclusion or exon skipping of known alternative exons, and considers differences in the inclusion rate (unspliced or misspliced species are ignored). By contrast, MaPSy considers reference splicing of reference constitutive exons, comparing these with unspliced RNAs (exon-skiped or misspliced species are ignored). Thus, Vex-seq considers variation that alters regulation of alternative cassette exon inclusion vs skipping, whereas MaPSy considers variants that impede normal constitutive exon splicing.
References
Soemedi R, Cygan KJ, Rhine CL, Wang J, Bulacan C, Yang J, Bayrak-Toydemir P, McDonald J, Fairbrother WG. 2017. Pathogenic variants that alter protein code often disrupt splicing. Nat Genet 49:848-855. doi:10.1038/ng.3837
Dataset provided by
Kamil Cygan and Will Fairbrother, Brown University
Revision history
29 Nov 2017 (v01): initial release
14 Dec 2017 (v02): Related challenges section added
26 Jan 2018 (v03): Note added
24 Sep 2018 (v04): Dataset availability added