SUMO ligase: distribution of growth scores
The growth score is calculated as follows. Let ci(t) be the raw barcode count for clone i at temperature t, then
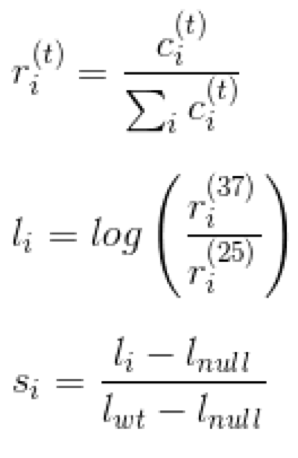
37 and 25 represent the selective and permissive temperatures, respectively.
Here, l_null represents the log ratio for a control strain carrying a null mutation. This step scales the scores such that mutant clones with growth behavior identical to the null control receive a score of 0, and mutant clones with growth identical to the wild-type control receive a score of 1. This means that any clone growing slower than the null control receives a negative score. We provide participants with the distribution of growth scores and the estimated standard errors in these measurements for each of the three subsets of mutants in the dataset. Standard error has been estimated as a function of the minimum raw barcode count as well as the agreement of the technical replicates, combined using a Bayesian method. The error estimates are a preliminary analysis and are provided to assist predictors in understanding the score distributions. Growth scores were not obtained for some of the mutant clones in the dataset; scores for these mutants are absent from the provided distributions, and these mutants will not be assessed.
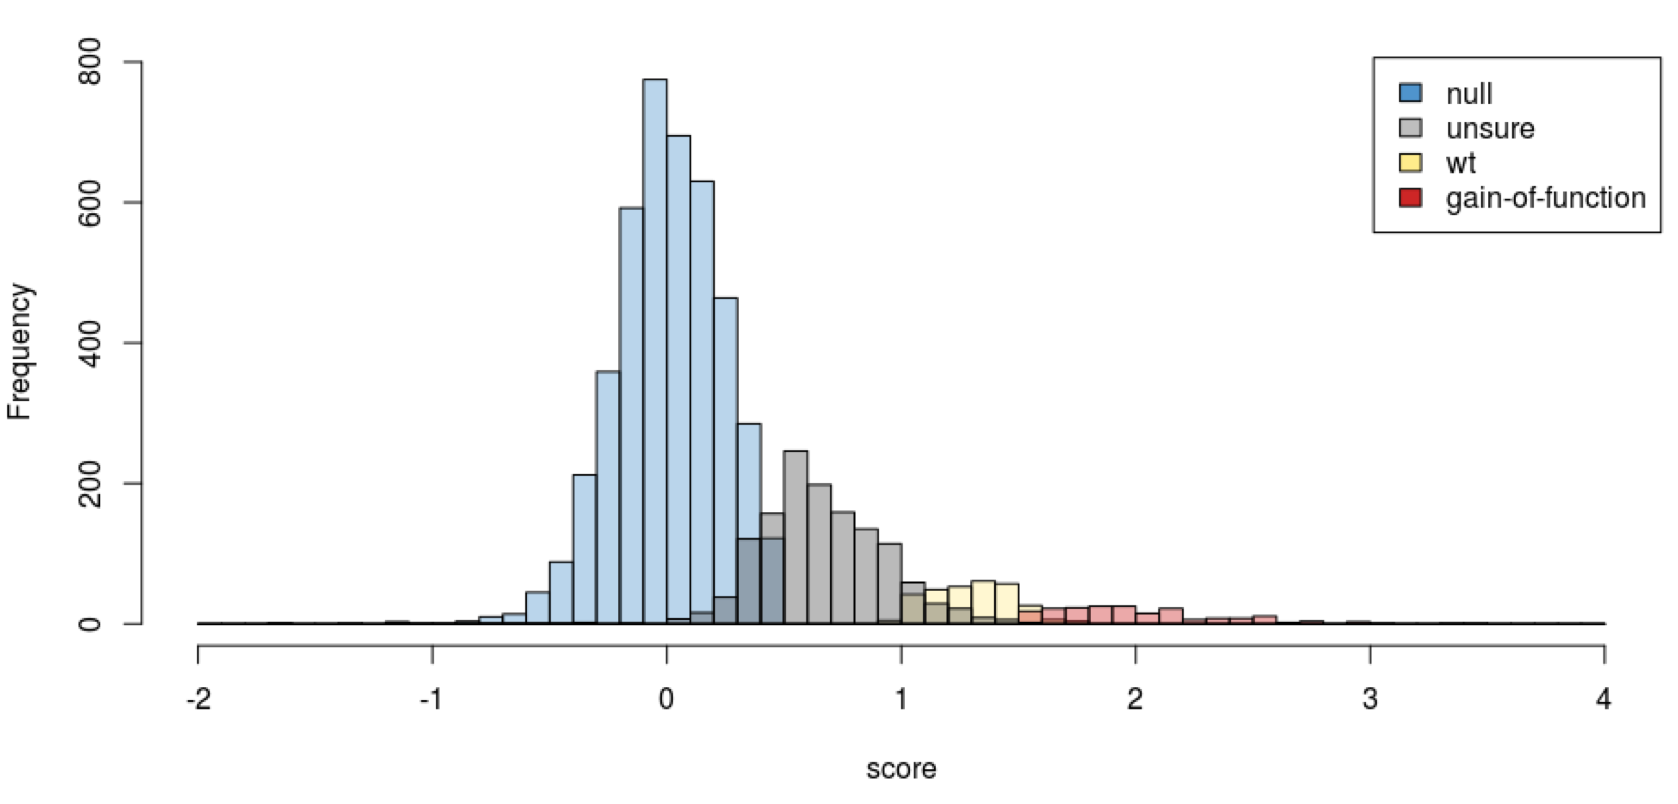
Statistical tests suggest that the amount by which mutant clones grow slower than the null control is not significant. Therefore, in the challenge, we do not allow negative growth score predictions. Below is a histogram in which the score distribution is color-coded according to the results of a conservative and preliminary t-test statistic designed to classify scores as not significantly different than 0 (null control; blue bars), not significantly different than 0 or 1 (gray bars), not significantly different than 1 (wild-type control; yellow bars), or significantly greater than 1 (more growth than wild-type; orange bars). The histogram is presented to illustrate the distribution of scores and the reason we do not allow predictions below 0, but do allow predictions >1, in the challenge. It should not be interpreted as meaning that the growth scores are binary. Instead, as described above, please see the estimated standard errors on the growth score measurements in the provided distribution files.
Frequently asked questions
Q: How can there be growth scores less than zero??
A: Although it is theoretically possible that expression of a toxic variant could cause cell death that leads a strain to become even less abundant than null controls, a more likely explanation stems from measurement error in estimated growth scores. No strain's growth score was significantly less than that of a set of control null alleles, after taking estimates of our measurement error into account.
Q: Wait a minute... measurement error??
A: Yes. Sorry, but this comes with the territory in real experiments. Although accurate estimates of measurement errors are difficult with each data point, our analysis of the aggregated data suggests that measurement error varies as a function of growth score. Accompanying the distribution of scores provided is an estimate of measurement error for each growth score, but just for the sake of intuition, stderr in growth scores is roughly ~0.2. Many individual growth scores can be distinguished from the growth values estimated for null and wild-type controls, but many cannot. However, even scores in the 'twilight zone' between null and wild-type growth scores will provide rank information that will be valuable in assessing the prediction success of participants in the challenge.
Updates
4 Nov 2015 (v01): initial release
12 Nov 2015 (v02): revised to clarify statistical tests